stough 202-
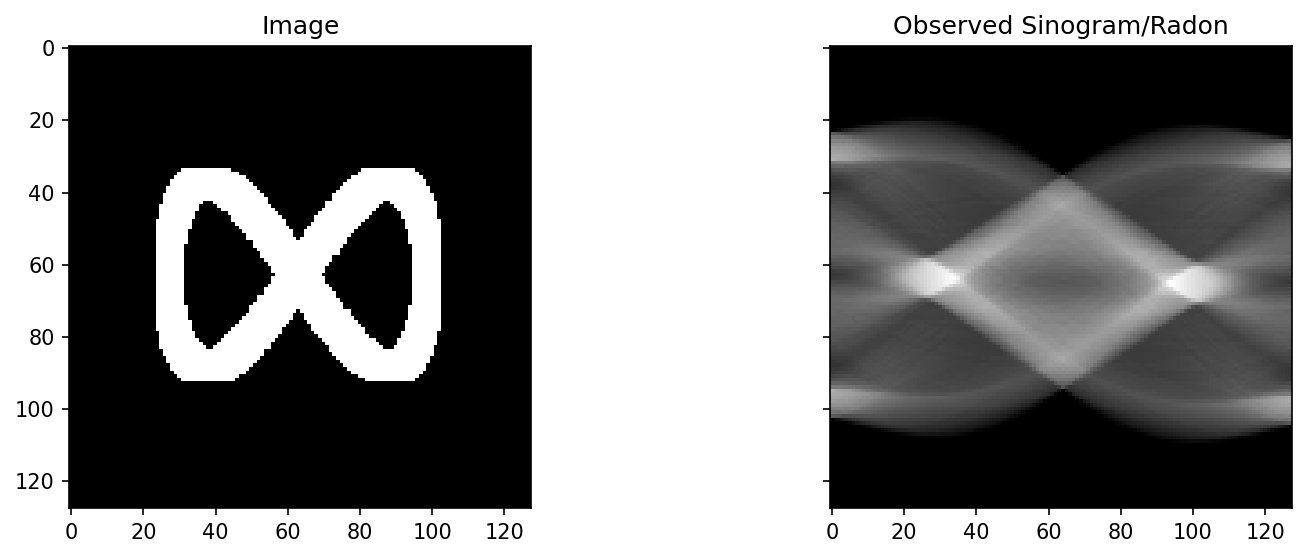
Using mouse movements to draw, and then show the radon transform of the resulting picture.
Click and drag in the left panel to paint. When you let go, the sinogram on the right updates. Two facts from the dot animation are all you need to predict what you’ll see: every painted point traces its own sinusoid, with amplitude equal to its distance from the center and phase equal to its angle around the center; and the Radon transform is linear, so the sinogram of your drawing is just the sum of the sinusoids of all its points. Start with a single dot, then a short line, and see if you can predict the sinogram before you release the mouse.
%matplotlib inline
import numpy as np
import matplotlib.pyplot as plt
from skimage.transform import radon
Parameters for the drawing.
image size, brush size, etc.
STYLE = 'circle'
IMSIZE = 128
BRUSHSIZE = 4
Even Cooler Animation
Now we connect mouse interactions with the visualization.
I = np.zeros((IMSIZE, IMSIZE))

# x, y = np.meshgrid(np.arange(-IMSIZE/2, IMSIZE/2),
#                    np.arange(-IMSIZE/2, IMSIZE/2),
#                    indexing='xy')
#
# mask = np.zeros(I.shape).astype(bool)

# For the radon image.
theta = np.linspace(0., 180., IMSIZE, endpoint=False)
R = radon(I, theta=theta, circle=True)


# Now that we have the image and its radon, let's plot

f, ax = plt.subplots(1,2, figsize=(12,4),
                     sharex=True, sharey=True)

# Initial Plots
Ia = ax[0].imshow(I, cmap='gray')
ax[0].set_title('Image')

Ra = ax[1].imshow(R, cmap='gray')
ax[1].set_title('Observed Sinogram/Radon')


mid = 0

# https://matplotlib.org/users/event_handling.html
def on_down_click(event):
    global I, theta, R, isDrawing, mid

    if event.inaxes is ax[0]:
        # print('%s click: button=%d, x=%d, y=%d, xdata=%f, ydata=%f' %
        #       ('double' if event.dblclick else 'single', event.button,
        #        event.x, event.y, event.xdata, event.ydata))

        if event.button == 3: # right-click, erase
            I[:] = 0
            return

        # I[:] = 0
        # mask = (x - (event.xdata - IMSIZE / 2)) ** 2 + \
        #        (y - (event.ydata - IMSIZE / 2)) ** 2 <= DISKRADIUS ** 2
        # I[mask] = 1

        # I[event.xdata - BRUSHSIZE: event.xdata + BRUSHSIZE, \
        # event.ydata - BRUSHSIZE: event.ydata + BRUSHSIZE] = 1

        x = np.round(event.ydata).astype(np.int32)
        y = np.round(event.xdata).astype(np.int32)

        I[x - BRUSHSIZE: x + BRUSHSIZE, \
        y - BRUSHSIZE: y + BRUSHSIZE] = 1

        ax[0].imshow(I, cmap='gray')
        # plt.show()
        plt.draw()

        mid = f.canvas.mpl_connect('motion_notify_event', on_motion)


def on_motion(event):
    global I, theta, R, isDrawing

    if event.inaxes is ax[0]:
        # mask = (x - (event.xdata - IMSIZE / 2)) ** 2 + \
        #        (y - (event.ydata - IMSIZE / 2)) ** 2 <= DISKRADIUS ** 2
        # I[mask] = 1

        x = np.round(event.ydata).astype(np.int32)
        y = np.round(event.xdata).astype(np.int32)

        I[x - BRUSHSIZE: x + BRUSHSIZE, \
        y - BRUSHSIZE: y + BRUSHSIZE] = 1

        #Faster if we wait on the radon til mouse release.
        # R = radon(I, theta=theta, circle=True)

        Ia.set_data(I)
        # ax[0].imshow(I, cmap='gray')
        # ax[1].imshow(R, cmap='gray')
        # plt.show()
        plt.draw()

def on_release(event):
    global I, theta, R, isDrawing, mid

    # Disconnect the motion callback
    f.canvas.mpl_disconnect(mid)

    R = radon(I, theta=theta, circle=True)
    ax[0].imshow(I, cmap='gray')
    ax[1].imshow(R, cmap='gray')

    # plt.show()
    plt.draw()


cid = f.canvas.mpl_connect('button_press_event', on_down_click)
# mid = f.canvas.mpl_connect('motion_notify_event', on_motion)
uid = f.canvas.mpl_connect('button_release_event', on_release)