%matplotlib inline
import numpy as np
import matplotlib.pyplot as plt
from skimage.transform import radon, iradon, rotate, matrix_transform
import matplotlib.animation as animation

# For importing from alternative directory sources
import sys
sys.path.insert(0, '../dip_utils')

from matrix_utils import (arr_info,
                          make_linmap)
from vis_utils import (vis_rgb_cube,
                       vis_hists,
                       vis_image,
                       vis_pair,
                       vis_surface)
from wavelet_utils import (make_dct_matrix,
                           make_haar_matrix)
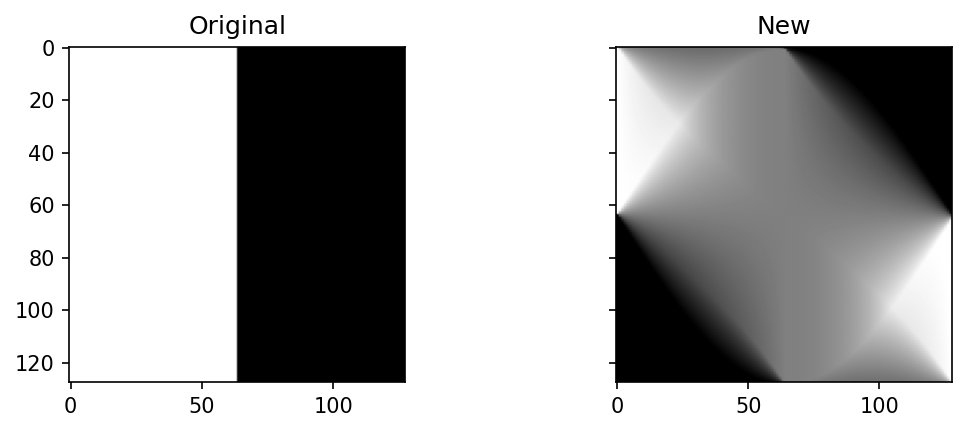
1. Viewing simple images in the sinogram space.
View several simple images in the sinogram space. For each, try to explain what you see.
Note, by “explain what you see,” I mean try to reason about how the content of the image relates to
where the sinogram is nonzero
where the sinogram is particularly bright versus not.
H = make_haar_matrix(128)
I1 = np.clip(np.outer(H[0], H[1]), 0, 1)
vis_image(I1, cmap='gray')
# View with Radon
# For the radon image.
theta = np.linspace(0., 180., 128, endpoint=False)
R = radon(I1, theta=theta, circle=True)
vis_pair(I1, R, cmap='gray')Explain what you see
# Another example
I2 = np.clip(np.outer(H[3], H[1]), 0, 1)
vis_image(I2, cmap='gray')
# View with Radon
# For the radon image.
theta = np.linspace(0., 181., 180, endpoint=False)
R = radon(I2, theta=theta, circle=False)
vis_pair(I2, R, cmap='gray', shared=False)plt.figure()
plt.plot(R[:,0])Explain what you see
# Another example
H = make_dct_matrix(128)
I3 = np.outer(H[6], H[0])
I3 = (I3-I3.min())/(I3.max() - I3.min())
vis_image(I3, cmap='gray')
# View with RadonExplain what you see
You might try this example with the circle parameter to radon set to False. If you look at just the first column of the sinogram, what does that tell you? What about if you plot the column midway through the sinogram, corresponding to
2. Manipulate a grayscale image in the radon/sinogram space.
Try a relatively simple image with a black background, will be quite a bit easier to understand. See a search like this.