stough 202-
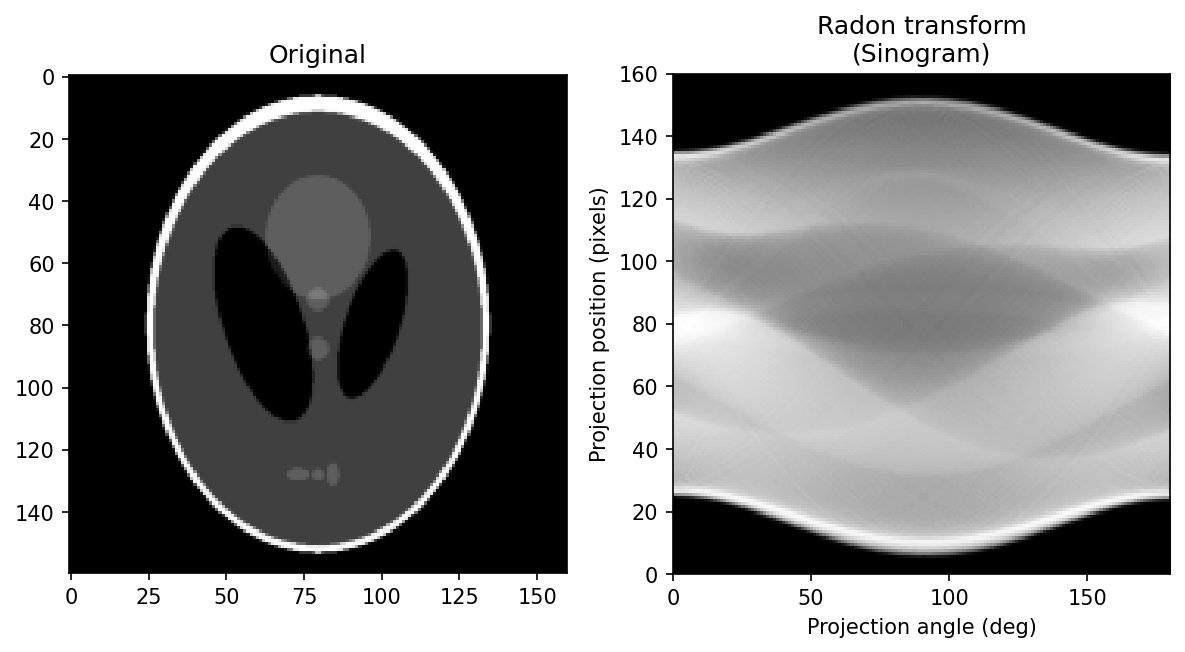
Ripped from sample code.
How does a CT scanner see inside your body? It can’t take a picture of a slice directly. Instead, it shines X-rays through the body along many parallel lines, from many angles, and measures how much each ray is attenuated. Each measurement is the sum (integral) of the tissue density along one line. The Radon transform describes exactly this: it takes an image and returns all of its line integrals.
To name a line, use its angle and its signed distance from the center of the image. The points on that line are those with . The Radon transform is then
where the delta function picks out just the points on the line. In words: for each angle , project the whole image onto a line at that angle, summing along the perpendicular direction, as if looking at the image edge-on from that direction. Stack those 1D projections side by side, one column per angle, and you get an image called a sinogram.
CT reconstruction is the inverse problem: given the sinogram, recover the image. That’s what skimage.transform.iradon does, and you’ll get to play with it in the Radon activity.
%matplotlib inline
import numpy as np
import matplotlib.pyplot as plt

from skimage import data_dir
from skimage.transform import radon, rescale
from skimage.color import rgb2gray
image = rgb2gray(plt.imread(data_dir + "/phantom.png"))
image = rescale(image, scale=0.4, mode='reflect') # 0.14 option, multichannel=False)
fig, (ax1, ax2) = plt.subplots(1, 2, figsize=(8, 4.5))
ax1.set_title("Original")
ax1.imshow(image, cmap=plt.cm.Greys_r)
theta = np.linspace(0., 180., max(image.shape), endpoint=False)
sinogram = radon(image, theta=theta, circle=True)
ax2.set_title("Radon transform\n(Sinogram)")
ax2.set_xlabel("Projection angle (deg)")
ax2.set_ylabel("Projection position (pixels)")
ax2.imshow(sinogram, cmap=plt.cm.Greys_r,
extent=(0, 180, 0, sinogram.shape[0]), aspect='auto')
fig.tight_layout()
plt.show()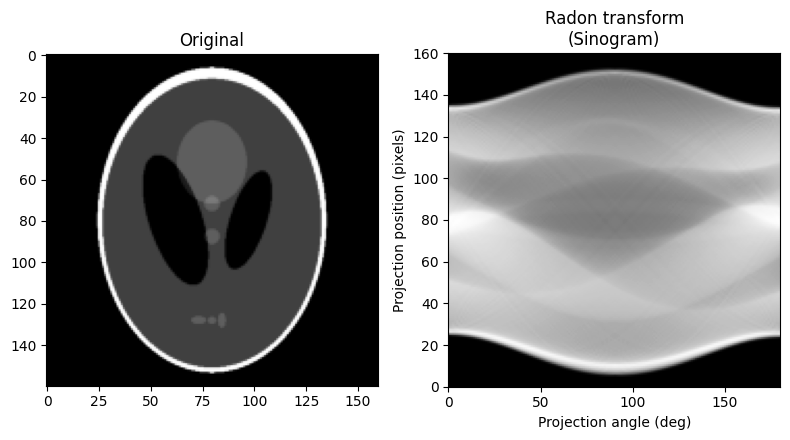
The test image is the Shepp-Logan phantom, a standard stand-in for a CT slice of a head, made of ellipses of different densities: a bright skull, darker brain, and a few small features.
In the sinogram, each column is the projection of the image at one angle, from to . (Angles from to would just repeat these projections flipped, so we don’t need them.) Each row is a position along the projection. A bright value means a line that passes through a lot of dense material. Notice how much brighter the sinogram is near the top and bottom edges of the skull’s shadow: those lines run tangent to the bright skull and travel a long way through it. circle=True tells radon to assume the image is zero outside the inscribed circle, so that every projection covers the same extent.
Why “sinogram”? Every individual point of the image traces out a sinusoid across the sinogram. The many overlapping wavy bands you see here are exactly that. The Radon dot animation shows why.