stough 202-
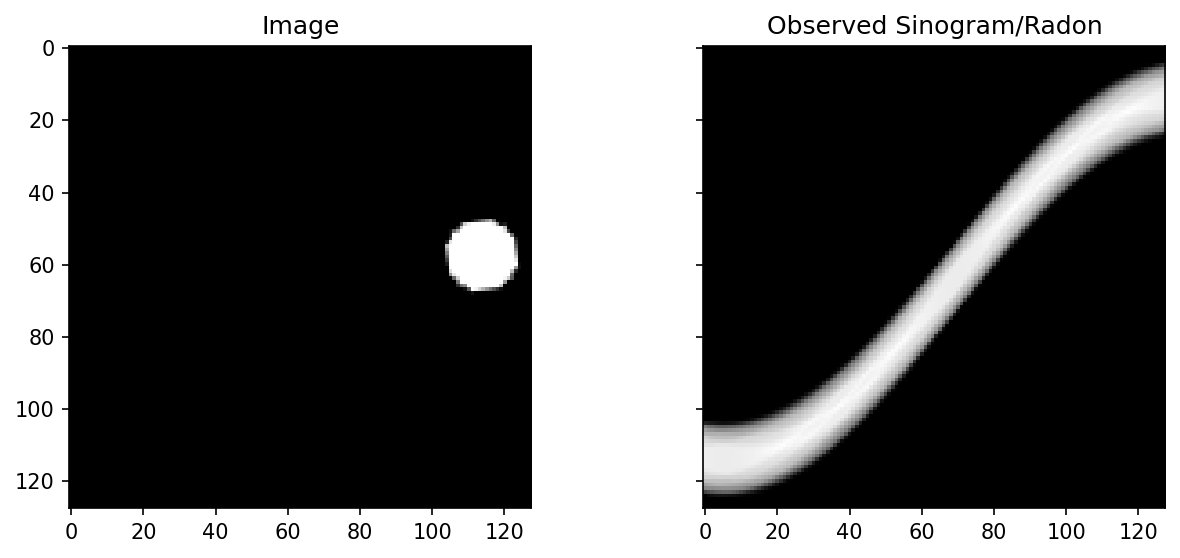
This is a quick demonstration the Radon transform, or sinogram, of a dot. We animate to see how the sinogram changes as the dot moves.
Imports
Note we’ll just rely on skimage.transform for the transform itself.
%matplotlib inline
import numpy as np
import matplotlib.pyplot as plt
from skimage.transform import radon, rotate, matrix_transform
import matplotlib.animation as animation

# For importing from alternative directory sources
import sys
sys.path.insert(0, '../dip_utils')

from matrix_utils import (arr_info,
                          make_linmap)
from vis_utils import (vis_rgb_cube,
                       vis_hists,
                       vis_image,
                       vis_pair,
                       vis_surface)
Defining an image of a disk
Parameters include the image size, the disk radius, and the radius of the path of the disk as I animate it. Given the animation, we’ll also need the number of frames to make a cycle and the millisecond interval between frames.
STYLE = 'circle'
FRAMES = 50
INTERVAL = 400
IMSIZE = 128
DISKRADIUS = 10
PATHRADIUS = 50

I = np.zeros((IMSIZE, IMSIZE))

x, y = np.meshgrid(np.arange(-IMSIZE/2, IMSIZE/2),
                   np.arange(-IMSIZE/2, IMSIZE/2),
                   indexing='xy')

mask = (x-PATHRADIUS)**2 + y**2 < DISKRADIUS**2
# xys = np.concatenate([np.expand_dims(p, axis = 1) for p in [y[mask], x[mask]]], axis=1)
# I tried briefly to generate the image independently each frame to avoid the blurring, was harder.

I[mask] = 1
vis_image(I, cmap='gray')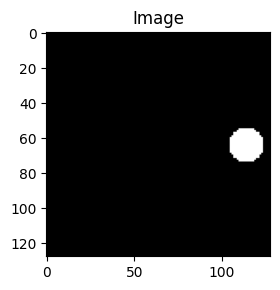
Visualize the Radon
The sinogram plot is by . Any particular pixel in the plot represents a line in the image space. The sum of intensities along that line in the image is the value of the pixel in the sinogram. (See the forward example for the definition.)
Why does a single dot make a sinusoid? Put the dot at position , a distance from the image center at angle , so and . The line at angle passes through the dot exactly when
So as sweeps from to , the dot appears in the projection at position : a cosine curve whose amplitude is the dot’s distance from the center and whose phase is its angle around the center. Our disk is 50 pixels from the center, so its sinusoid swings 50 pixels to either side of the middle row. Over we see half of one full period.
# For the radon image.
theta = np.linspace(0., 180., IMSIZE, endpoint=False)

R = radon(I, theta=theta, circle=True)
vis_pair(I, R, cmap='gray')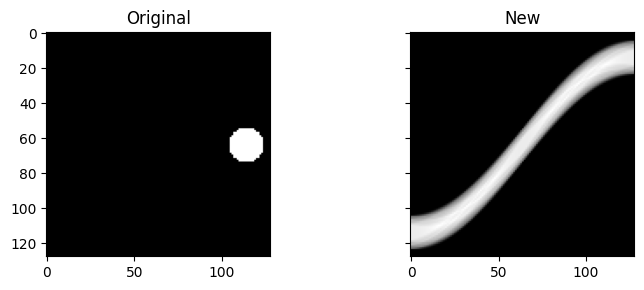
Animate the Dot
We’ve now also added button-clicking functionality to our interactive plotting skills.
# Now that we have the image and its radon, let's plot

f, ax = plt.subplots(1,2, figsize=(10,4),
                     sharex=True, sharey=True)

# Create the artists
Ia = ax[0].imshow(I, cmap='gray')#, animated=True)
ax[0].set_title('Image')

Ra = ax[1].imshow(R, cmap='gray')#, animated=True)
ax[1].set_title('Observed Sinogram/Radon')

angleAmt = 360/FRAMES


# Needs to update the array data and the texts, then
# return the artists. see:
# https://matplotlib.org/api/_as_gen/matplotlib.animation.FuncAnimation.html
#
def updateFig(*args):
    global I, R, angleAmt, theta

    Ia.set_array(I)
    Ra.set_array(R)

    # For next time...
    I = rotate(I, angleAmt, order=1)
    R = radon(I, theta=theta, circle=True)

    return Ia, Ra,

ani = animation.FuncAnimation(f, updateFig,
                              interval=INTERVAL,
                              blit=True, repeat=True)


# https://matplotlib.org/users/event_handling.html

def onclick(event):
    global I, x, y, mask, theta, R

    if event.inaxes is ax[0]:
        print('%s click: button=%d, x=%d, y=%d, xdata=%f, ydata=%f' %
              ('double' if event.dblclick else 'single', event.button,
               event.x, event.y, event.xdata, event.ydata))

        I[:] = 0
        mask = (x - (event.xdata - IMSIZE / 2)) ** 2 + \
               (y - (event.ydata - IMSIZE / 2)) ** 2 <= DISKRADIUS ** 2
        I[mask] = 1
        R = radon(I, theta=theta, circle=True)

        Ia.set_array(I)
        Ra.set_array(R)

        # ax[0].imshow(I)
        plt.show()
        plt.draw()


cid = f.canvas.mpl_connect('button_press_event', onclick)
/tmp/ipykernel_3674/1803367455.py:32: UserWarning: frames=None which we can infer the length of, did not pass an explicit *save_count* and passed cache_frame_data=True. To avoid a possibly unbounded cache, frame data caching has been disabled. To suppress this warning either pass `cache_frame_data=False` or `save_count=MAX_FRAMES`.
ani = animation.FuncAnimation(f, updateFig,
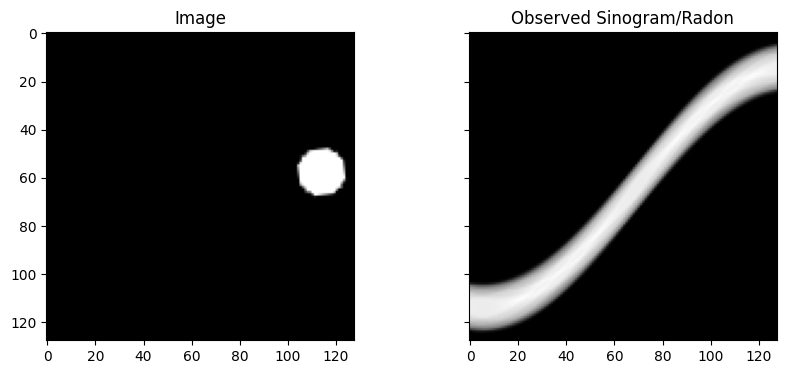
As the disk circles the center, its distance stays the same, but its angle advances, so the sinusoid keeps the same amplitude and slides along in phase. Click somewhere in the image to move the disk: the sinusoid’s amplitude jumps to the new distance from the center, and a disk right at the center makes a flat line. (A center point is at in every projection.)
About the code: rather than redraw the disk each frame, updateFig rotates the image a few degrees with skimage.transform.rotate. Each rotation resamples the image with bilinear interpolation (order=1), so the disk gets slightly blurrier every frame. That’s the accumulating cost of repeated interpolation we saw in coordinate operations. Clicking redraws a sharp disk.